ASX:CBABanksDiversified Banks
Commonwealth Bank of Australia
$174.030
+$1.730 (+1.00%)
Day Range
$171.040 – $174.260
52 Week Range
$146.980 – $185.590
Volume
1.85M
Avg Volume (10D)
1.68M
Market Cap
$291.23B
P/E Ratio
28.77
Price Chart
Market Statistics
Open$172.150
Previous Close$172.300
Day High$174.260
Day Low$171.040
52 Week High$185.590
52 Week Low$146.980
Valuation
Market Cap291.23B
Shares Outstanding1.67B
P/E Ratio (Annual)28.77
P/E Ratio (TTM)28.02
Dividend Yield2.84%
Price to Book3.77
Trading Activity
Volume1.85M
Value Traded321.37M
Bid$173.700 × 580
Ask$174.100 × 500
Performance
1 Day1.00%
5 Day1.31%
13 Week-0.26%
52 Week0.32%
YTD8.38%
Technical Indicators
RSI (14)66.55
50-Day SMA$164.853
200-Day SMA$165.795
Latest News
ASX 200
Weekly Wrap: Geopolitical Relief and Rate Hopes Spark Late Week Rebound for the ASX
ASX rebounds late week: easing rate fears and Persian Gulf peace hopes power a 0.41% Friday rise, after a 7-week low.
Hot Topics
Market Wrap: Market Sharply Weaker As War Hostilities Resume
ASX 200 plunges 1.5% on renewed US-Iran hostilities as oil spikes over $100; banks and energy hammered, Tabcorp shares dive 14%.
Hot Topics
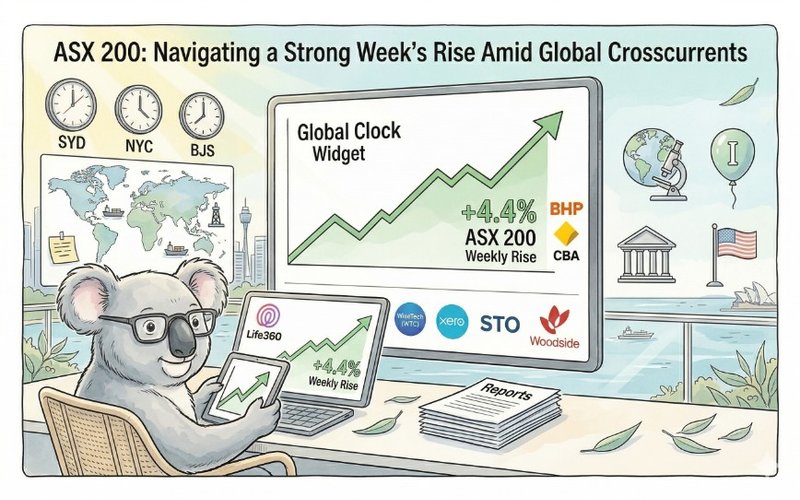
Weekly Wrap: Strong Week Despite Late Fade
ASX up 4.4% for the week; strongest since Oct 2022, despite Friday fade. Magellan-Barrenjoey merger approved; Telix jumps on US regulator nod; Iran talks ahead.

Hot Topics
Weekly Wrap: Shares fall another 2.6% for the week as conflict worsens
ASX 200 slides 2.6% this week to 8,617 as Iran-Israel conflict lifts oil above $100; NST and SYR plunge, while EOS soars on a Middle East contract.